Hello friends!
I am glad to present you my new work - Statisct V2.0. This is the first version of it, and at the request of users, it will be improved and refined.
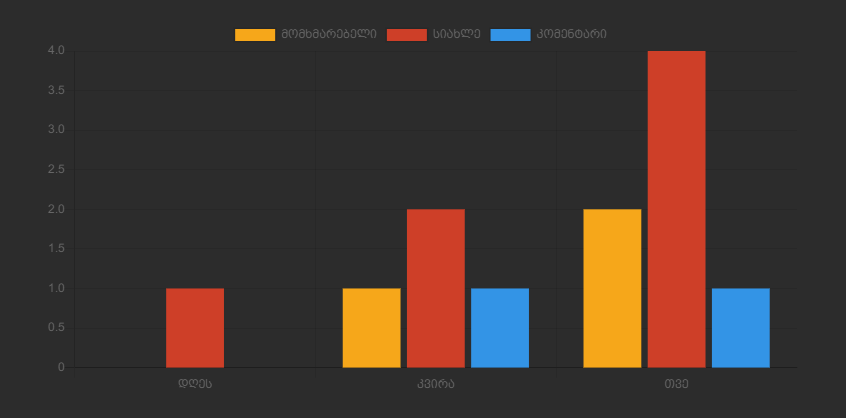
What is t his hack?
1.hack collects statistics in the form of charts 2. The data is provided in the form of a convenient graph on the "Site statistics" page. 3.using chartjs.org
Instalation
1.Change All inshstats.tpl
<script src="https://cdn.jsdelivr.net/npm/chart.js@2.8.0"></script>
<article class="box story">
	<div class="box_in dark_top stats_head">
		<canvas id="main" style="width: 240px;"></canvas>
	</div>
	<div class="box_in">
		<div class="statistics">
			<div class="stat_group">
                <canvas id="news" style="width: 240px;"></canvas>
			</div>
        </div>
    </div>
    <div class="box_in dark_top stats_head">
		<canvas id="users" style="width: 240px;"></canvas>
	</div>
</article>
<style type="text/css">
	.canvas {
		width: 70%;
	}
</style>

<script>
var ctx = document.getElementById("main").getContext("2d");
var data = {
  labels: ["Day", "Week", "Month"],
  datasets: [{
    label: "Users",
    backgroundColor: "#f6a71a",
    dаta: [{user_day}, {user_week}, {user_month}]
  }, {
    label: "Newes",
    backgroundColor: "#ce3f28",
    dаta: [{news_day}, {news_week}, {news_month}]
  }, {
    label: "Comments",
    backgroundColor: "#3394e6",
    dаta: [{comm_day}, {comm_week}, {comm_month}]
  }]
};

var myBarChart = new Chart(ctx, {
  type: \'bar\',
  dаta: data,
  options: {
    barValueSpacing: 20,
    scales: {
      yAxes: [{
        ticks: {
          min: 0,
        }
      }]
    }
  }
});

</script>

 <script>
var ctx = document.getElementById("users").getContext("2d");
var data = {
  labels: [\'All User\', \'Ban User\'],
        datasets: [{
            label: \'Users\',
            backgroundColor: \'#f6a71a\',
            borderColor: \'#fff\',
            dаta: [{user_num}, {user_banned}]
  }]
};

var myBarChart = new Chart(ctx, {
  type: \'bar\',
  dаta: data,
  options: {
    barValueSpacing: 20,
    scales: {
      yAxes: [{
        ticks: {
          min: 0,
        }
      }]
    }
  }
});
</script>

<script>
var ctx = document.getElementById(\'news\').getContext(\'2d\');
var myDoughnutChart = new Chart(ctx, {
    type: \'doughnut\',
    dаta: {
        labels: [\'All News\', \'Approved\', \'On moderation\',\'Comment\'],
        datasets: [{
            label: \'News\',
            backgroundColor: [
                \'#f6a71a\', // Color Of Label - News
                \'#ce3f28\',
                \'#3394e6\',
                \'#4CAF50\'
            ],
            borderColor: [
                \'#fff\',
                \'#fff\',
                \'#fff\'
            ],

            dаta: [{news_num}, {news_allow}, {news_moder},{comm_num}]
        }]

    },

    options: {}
});
</script>
0 Comments
Please Log in to join the conversation.
No comments yet.